
After markets set a high bar going into 2024—pricing in half-a-dozen rate cuts by year-end—the last six months have seen investors walking back those lofty expectations, with all eyes on a US central bank seemingly content to kick the can down the road toward “greater confidence” in disinflation’s progress. Even so, with mounting evidence of a cooling economy hinting at a soft landing and September Fed pivot, investors were confident enough in Q2 to bid equities to new highs. Below, we share data-driven views on stories we’re following and offer our outlook for markets entering the second half.

Rayliant Global Advisors is a global investment manager with offices in Los Angeles, London, Hong Kong, Hangzhou and Taipei. With over US$15-billion in assets linked to Rayliant's strategies, its clients include some of the world's largest sovereign wealth funds, pension plans, and other institutional investors. Rayliant's award-winning team is an independent advisor to East West Bank regarding global economies and markets. East West Bancorp, Inc. (the parent company of East West Bank) holds a 49.9% stake in Rayliant Global Advisors.
Quarterly Commentary: Asset Classes
Equities
After disconcerting data on inflation through the first three months of the year dashed earlier hopes of plentiful Fed rate cuts in 2024, the second quarter brought better news, with prices seeming to resume a disinflationary trend and signs that the US economy might be cooling. The resulting rise in confidence that the US central bank might stick a soft landing, combined with ongoing investor enthusiasm toward stocks with exposure to the AI theme, led equity indices higher in Q2 (see Figure 1). US shares posted particularly strong performance, rising 4.3% for the quarter, with growth stocks dominating. Developed Markets outside the US were modestly negative over the last three months, returning -0.4%, weighed down by losses among Eurozone stocks and continued depreciation of the Japanese yen, whose slide against the greenback in Q2 was enough to turn a 1.6% gain on the TOPIX index over the quarter to a -4.4% loss in dollar terms. Despite stocks in China slipping by -1% in the second quarter on worries its economic rebound might be losing steam, shares across the rest of the Emerging Markets—which tend to be particularly sensitive to good news on US interest rates—put the global EM basket up 5.1% for the quarter, solidly outperformed their DM counterparts.
Figure 1: Equity Market Performance (Returns as of 30 June 2024)
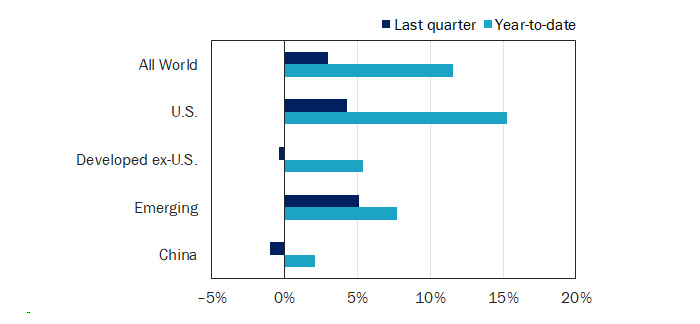
(Source: MSCI ACWI, S&P 500, MSCI World ex-USA, MSCI Emerging Markets, and CSI 300, all expressed in USD, except CSI 300 in CNY, via Bloomberg..)
Taking stock of equity performance at this year’s halfway mark, the US shares that still make up the bulk of most globally diversified investors’ equity portfolios have gained an impressive 15.3% year-to-date in 2024—a far cry from the median 2% full-year return sell-side analysts were predicting last December. We all know that past performance is no promise of future results, but if history does repeat, the last three decades of data suggest it will be a good second half for stocks in the S&P 500, for which gains through June have tended to predict further appreciation over the latter six months of the year (see Figure 2). It turns out that when there’s a US Presidential election—and one happens to be coming up in November—the odds have been particularly good, with the S&P 500 posting positive performance from July through December in eight out of the last ten election years. The two elections in that period that witnessed US stocks down in the second half also sported first-half losses.
Figure 2: Positive First-Half S&P 500 Returns Historically Bode Well for Rest of Year
It was a stellar first half of 2024 for US stocks, with shares in the S&P 500 Index climbing just over 15% year-to-date, through the end of June, making thirty-one new record closing highs along the way: half a dozen more than the average number posted over the last fifteen full years. Does that tell us anything about likely performance over the next six months? Going back to 1990—a small sample, to be sure—there's at least a hint that US equities could be in for good times in the second half, with the S&P 500 tending to do better from July through December in years with positive performance in the first two quarters. Investors will be hoping this year plays out like 2021, whose H1 return was nearly identical to this year's, and whose second half brought another 11%.7% of upside.
S&P 500 total return, measured during first vs. second half of each year, 1990 – 2023
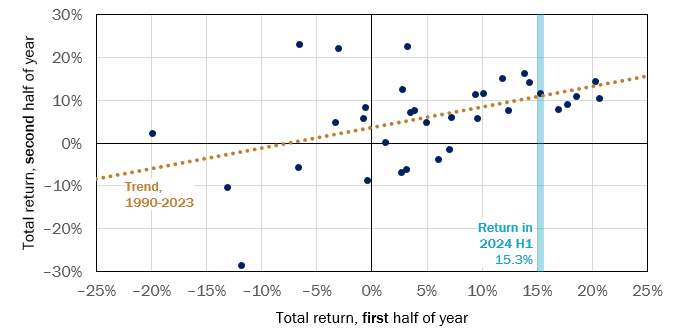
(Source: Rayliant Research, as of Jun. 30, 2024.)
Notwithstanding the stellar performance of equities so far this year, one aspect of the rally that’s left many investors more than a little concerned is the concentration of those gains among a relatively small set of high-profile tech stocks. The bull market’s breadth did improve somewhat in the first quarter, but retreated again in Q2, as stocks in the vaunted ‘Magnificent 7’ cohort once again trounced the rest of the market (see Figure 3). Indeed, with AI darling Nvidia’s ascendence to the $3-trillion-market-cap club in June, there were three firms in that elite set, whose weight in the S&P 500 index totaled around one-fifth of the index; by comparison, even at the height of the late-90s Internet bubble, the top three constituents weighed in at less than 10% of the index. Similarly, the top ten holdings in the S&P 500 account for around 35% of weight today, markedly higher than the top ten stocks’ 27% footprint at the peak of dot-com mania. That doesn’t necessarily mean US shares are in a bubble—earnings growth has surely been impressive—though we do believe investors will benefit from some diversification outside the Mag 7 when the rally broadens out to touch more of the market.
Figure 3: Stocks in Magnificent 7 Put Remaining 493 Names to Shame in Q2
While a broad set of US stocks participated in the market's first-quarter rally, we witnessed that breadth give way in Q2 to gains much more concentrated in a handful of stocks: the usual suspects in the 'Magnificent 7', for example, five of which scored double-digit gains in the first half of the year. Driven by a resurgence of enthusiasm for the AI mega trend captivating investors since ChatGPT arrived in late 2022—not to mention a continuation of Nvidia's stellar financial outperformance—shares in big tech have registered disproportionate gains year-to-date. Indeed, through the end of June, Mag 7 stocks have meaningfully outpaced the remaining 493 names in the S&P 500, adding 32.8% in the first half, versus a still-very-respectable 8.3% for those hundreds of 'also-ran' listings.
Cumulative year-to-date total return, subsets of S&P 500 stocks, Jan. 1, 2024 – Jun. 30, 2024
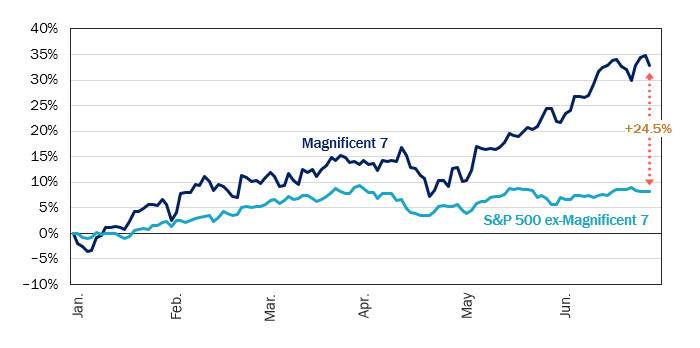
(Source: Rayliant Research, as of Jun. 30, 2024.)
And what could lead to such a rotation from mega-cap tech stocks to the rest of the S&P 500—or even small-cap stocks? The aforementioned soft landing couldn’t hurt: a rising macro tide that would lift all ships. That outcome seemed somewhat less probable at the end of Q1, after a series of uncomfortably hot inflation prints to start the year, though inflation surprises moderated as the quarter wore on (see Figure 4). On the other side of the Fed’s dual mandate, cooling in the US labor market apparent toward the end of the Q2, along with slowing consumer spending and overall economic growth, contributed to investors’ renewed optimism around a smooth resolution to the current monetary policy cycle. We tend to believe one of the biggest threats to a continuation of the first half rally in risk assets is divergence apparent in the chart below. That could come from upside risk to inflation, still somewhat above the Fed’s 2% target, but also a sharper downturn in the economy. With respect to the latter, we note that recent data from the Federal Reserve Bank of San Francisco show Americans’ pandemic savings ran out at the end of Q1. That will undoubtedly make it harder for US consumers’ insatiable spending to continue propping up the economy in the face of record-high rates.
Figure 4: Fed's Work Complicated in 2024 by Diverging Data on Growth and Inflation
On the US macroeconomic front, two key themes emerged in the first half of the year. Inflation surprises tended to be positive, with fears that price pressures could reaccelerate in Q1 rising on the back of a string of hotter-than-expected CPI prints, moderating a bit as data came in closer to expectations during Q2. Perhaps more concerning—and revitalizing fears of dreaded 'stagflation'—was a series of surprises in the other direction on the growth dimension. Signs the will of US consumers might be finally buckling, a first-quarter GDP well below economists' expectations, along with data showing a cooling job market have further complicated matters for a US Federal Reserve hoping to see a stronger trend toward disinflation before initiating rate cuts.
Bloomberg US Economic Surprises Indices, 12-week moving average, Oct. 2014 – Jul. 2024
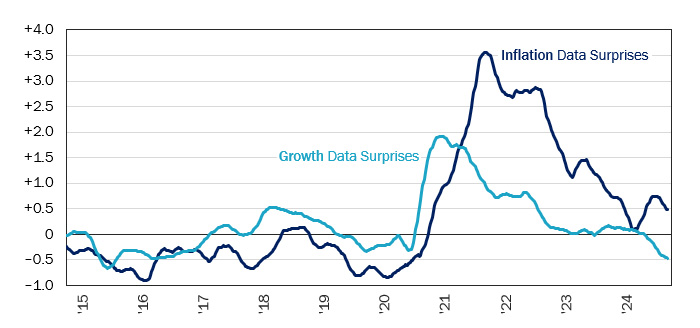
(Source:Bloomberg, Rayliant Research, as of Jul. 12, 2024.)
Figure 5: Dwindling Pandemic-Era Savings Could Account for Softening Spending
Since the Fed started tightening rates in 2022, American consumers have deservedly taken much of the credit for a surprisingly strong US economy. Part of the reason US households were able to keep spending—and corporate earnings were able to keep climbing—was the massive hoard of excess savings Americans accumulated during the first year of the pandemic. According to calculations by the San Francisco Fed, that cash pile topped out at $2.1 trillion in August 2021, and consumers have been drawing down on it steadily ever since. In a worrying sign for future spending, the same data show excess savings went negative in March. That could account for indications, in retails sales data and on Q1 earnings calls, that American households are finally tightening their belts.
Americans' cumulative excess savings since pandemic began, Mar. 2020 – May 2024
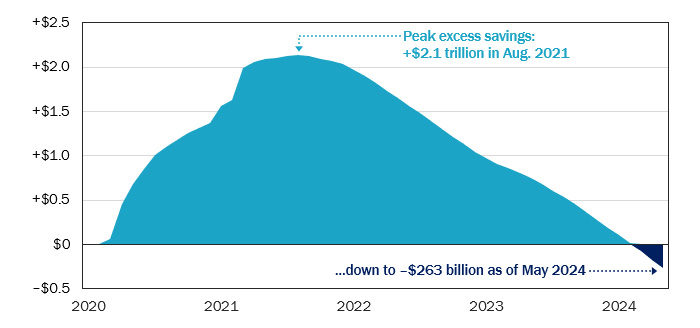
(Source: Rayliant Research, San Francisco Fed, as of May 31, 2024.)
Fixed Income
Not surprisingly, global bond investors’ eyes were squarely on the world’s central banks in Q2, seeking any indication that over two years of tight monetary policy might be giving way to more accommodative conditions. The Bank of Canada and European Central Bank obliged with well-telegraphed rate cuts in early June, while data showing a cooler US economy rolled in as the quarter drew to a close: all hopeful signs for a broader pivot in central bank policy. Unfortunately, given how exuberant yield traders had been at the outset of 2024—not to mention major volatility on the political front adding to bond market uncertainty in some regions—fixed income investors faced mixed results for the quarter (see Figure 6).
Figure 6: Fixed Income Market Performance Returns as of 30 June 2024
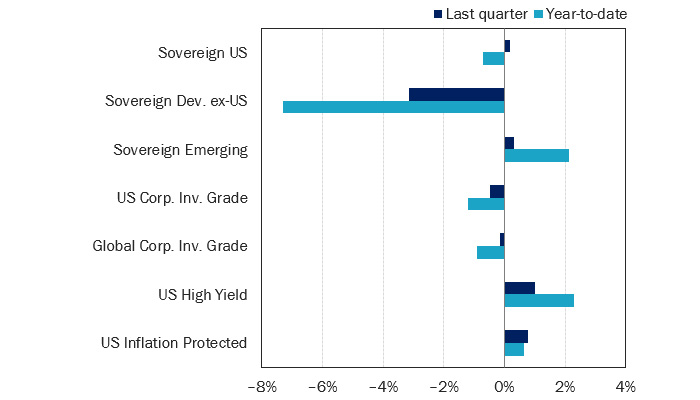
(Source: ICE US Treasuries Core, S&P Int. Sov. ex-US, JPMorgan EMBI Global Core, iBoxx USD Liquid Inv. Grade, Bloomberg Global Agg. Corp., iBoxx USD Liquid High Yield, Bloomberg US Gov. Inflation-Linked All Mat., all expressed in USD, via Bloomberg.)
With so much debate in recent months as to whether the Fed would find themselves comfortable enough to cut rates by the end of Q3, it would be easy to forget that as recently as early January, the question among futures traders was whether it would be six or seven cuts by year-end. Never mind the fact that the Fed’s December 2023 dot plot showed just three reductions in its benchmark rate for the full year. Fast forward six months, and the FOMC has reduced its anticipated degree of easing in 2024 to just a single cut, while markets are still relatively optimistic—but now price in just two moves by the Fed through December (see Figure 7). Consistent with macro conditions having improved by quarter-end, though global money managers polled by Bank of America in June still voted ‘higher inflation’ as the greatest tail risk to their portfolios, the degree of fear that prices will reaccelerate has waned since May (geopolitical risk and US election uncertainty, by contrast, have been gaining ground).
Figure 7: Traders Have Gradually Tempered Expectations for Fed Cuts in 2024
When last December's FOMC dot plots revealed the US central bank intended to begin easing over the next twelve months, with a median expectation of three rate cuts, traders reacted with more than a little enthusiasm, pricing at least six rate reductions into December 2024 Fed funds futures. We were much more skeptical, and our concerns proved out, as first-quarter signs of sticky inflation made it impossible for the Fed to pivot in the first half of the year. Traders reluctantly revised downward their hopes for a handful of cuts, settling on a more conservative one or two moves by the Fed as the quarter drew to a close. At their June meeting, members of the FOMC caught up, penciling into their Q2 dot plots one solitary median cut to occur sometime in the second half.
Expected number of 2024 rate cuts by the US Federal Reserve, Dec. 14, 2023 – Jul. 5, 2024
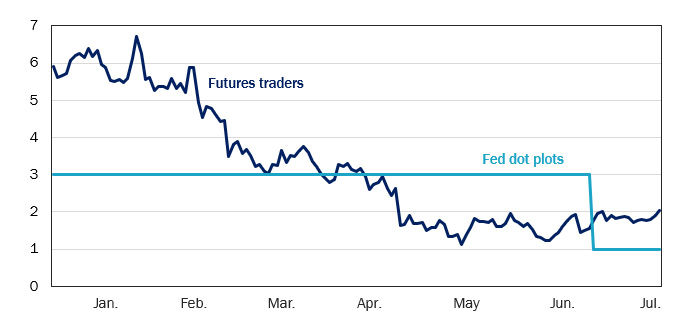
(Source: Rayliant Research, US Federal Reserve, CME Group, as of Jul. 5, 2024.)
Investors in high yield bonds will be especially sensitive to hawkish shifts in the timeline for easing, as the implications of higher-for-longer Fed policy are particularly pronounced among companies on the edge of survival. A report on corporate bankruptcies in the first half of the year by S&P Global Market Intelligence illustrates how serious that situation is becoming, with the number of large firms failing by June hitting a level not reached since 2010 in the wake of the Great Recession (see Figure 8). As S&P researchers noted, that jump in bankruptcy filings over the last few months likely reflects discouraged managers recognizing rate cuts won’t come fast enough and finally giving in. Uncertainty in the fixed income markets—not only with respect to when easing arrives, but also in terms of Washington’s precarious fiscal circumstances and political drama as the November election nears—has also shown up in the Treasury market, where liquidity is worse, by some measures, than at any time since 2008, amidst the Global Financial Crisis (see Figure 9).
Figure 8: Inevitable Impact of 'Higher-For-Longer' Showing Up in US Bankruptcy Filings
With interest rates holding at a 23-year high since last July, consumers and businesses are feeling the pain. That anguish is evident in data on large corporate bankruptcies tracked by S&P Global Market Intelligence, with a count of companies throwing in the towel during June surpassing highs last hit amidst the COVID shock at the beginning of 2020, while the number of first-half bankruptcies tallied its highest mark since 2010, which saw many firms still struggling in the shadow of the Great Recession. Indeed, each of the last four months, beginning in March 2024, has featured a bankruptcy count exceeding the pre-pandemic average. Such stats underscore the risk of taking stock market strength for granted, as years of tight Fed policy take an increasing toll on the US economy.
Monthly bankruptcy filings by S&P Global Market Intelligence firms, Jan. 2020 – Jun. 2024
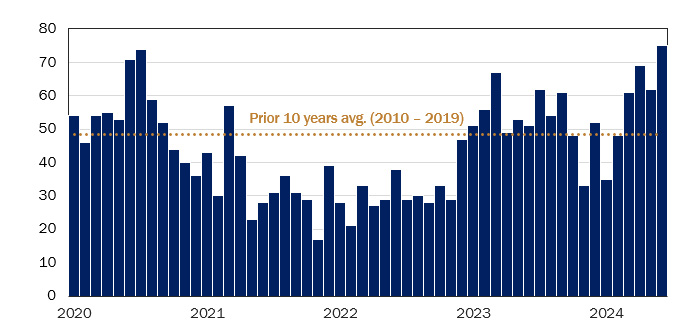
(Source: Rayliant Research, S&P Global Market Intelligence, as of Jun. 30, 2024.)
Figure 9: Liquidity Rut in Treasury Trading Points to Major Market Uncertainty
Searching for signs of stress in the global financial system, an obvious place to turn is the market for US Treasury securities, weighing in at a size of roughly US$27 trillion. Bloomberg's US Treasury Market Liquidity Index attempts to spot trouble by looking at bonds whose prices deviate from fair value: what should be an uncommon occurrence in a market as actively traded as this one. Based on this measure, Treasury liquidity is lower than at any other point since the Global Financial Crisis (though still way off those lows). Rather than signaling a malfunctioning market on the verge of crisis, we see such stats as suggesting ample uncertainty on everything from the path of inflation and Fed policy to America's fiscal condition and the implications of a potentially chaotic US election cycle.
Bloomberg US Treasury Market Liquidity Index, Oct. 2010 – Jul. 2024
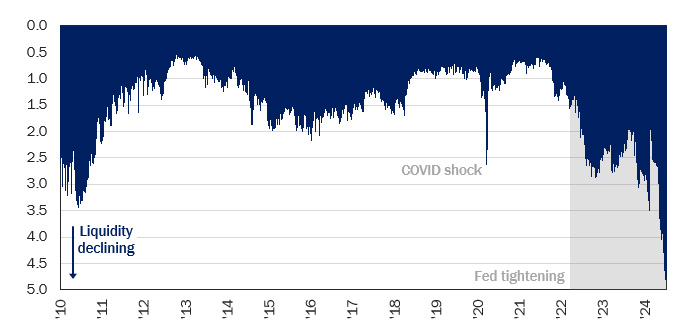
(Source: Rayliant Research, Bloomberg, as of Jul. 7, 2024.).
Alternatives
As was the case in the first quarter, real estate investments gave up ground in Q2, while a broad basket of commodities rose modestly (see Figure 10). Though we continue to view many REITs as having solid fundamentals and operating performance, the hawkish shift in sentiment toward Fed cuts throughout the last six months has weighed on a sector especially sensitive to interest rates (see Figure 11). While that relationship broke down a bit in the early days of the pandemic, industry group NAREIT recently reported that the rolling one-year correlation between REIT and 10-year Treasury total returns crept up to –0.7 in 2024, a level not seen in over two decades. That relationship has been a headwind to real estate investments so far this year, though it should turn into a tailwind when rate cuts finally arrive.
Figure 10: Alternatives Performance Returns as of 30 June 2024
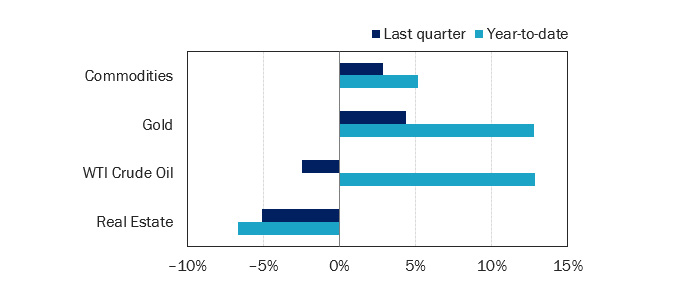
(Source: Bloomberg Commodity Index, Gold Spot, WTI Crude, iShares International Developed Real Estate ETF, all expressed in USD, via Bloomberg.)
Figure 11: REITs' Rate Sensitivity Should Also Factor When Fed Pivots
Given the obvious adverse impact of rate hikes on property investments, waning sentiment toward a Fed pivot has weighed on real estate so far in 2024. Indeed, a FTSE NAREIT index tracking US real estate investment trusts has traced an approximate mirror image of moves in 10-year US Treasury yields for much of the last decade. The period from the beginning of the pandemic to the onset of Fed tightening was an exception, as REITs clawed their way back from a deep COVID drawdown at the same time bonds priced in concern about the end of easy Fed policy—and, eventually, the impact of growing price pressures. This plot says little about improving REIT fundamentals over the last few years, but it does explain why we expect eventual cuts to lift their valuations.
Performance of US real estate investments vs. 10-year Treasury yield, Jul. 2014 – Jun. 2024
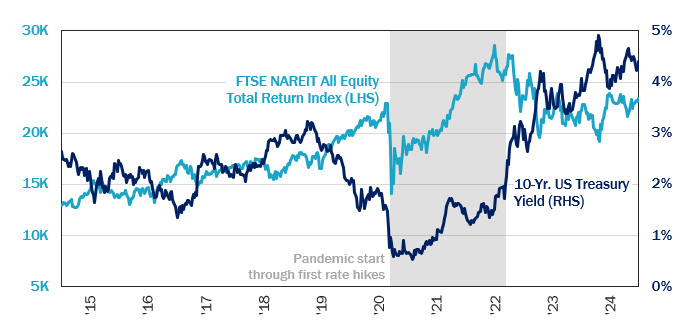
(Source: Rayliant Research, as of Jun. 30, 2024.)
While the relationship between real estate performance and interest rates is obvious, investors may be less familiar with the ramifications of Fed policy for commodity prices. To that end, the research team at Goldman Sachs recently performed an investigation into behavior of commodity sectors and a range of individual commodities to policy-induced changes in Treasury yields, finding that Fed cuts are, on average, a positive for the broad commodity basket, provided they come in a non-recessionary environment (see Figure 12). In particular, they tipped industrial metals and crude oil as likely gainers if a soft landing prevails, especially as time wears on and the effects of easing work their magic on demand. While our allocations to commodities are often strategic, meant to diversify against inflationary and geopolitical shocks, we believe lower rates and a rebound in global demand could yield solid returns for commodities amidst tight supply for many resources today.
Figure 12: Commodities—Especially Metals—Likely to Benefit When Rate Cuts Come
Although investors' hopes of plentiful rate cuts and a swift start to easing have soured over the course of the year, we suspect that whenever that pivot does come, the accommodative conditions it brings will provide a nice boost to global manufacturing—and, consequently, the commodities that power industrial production around the world. A nice bit of analysis by Goldman Sachs earlier this year estimated the price impact of a 100-bps drop in yield on US Treasuries, assuming no recession, based on data from past Fed policy cycles. Consistent with our thinking on the benefits of cuts, they found though a diversified commodity basket would likely perform well, the biggest gains would be in industrial metals: the sector which happened to contribute most to commodities' positive Q2 return.
Estimated impact of a 100-bps policy-induced decline in US 2-year Treasury yields
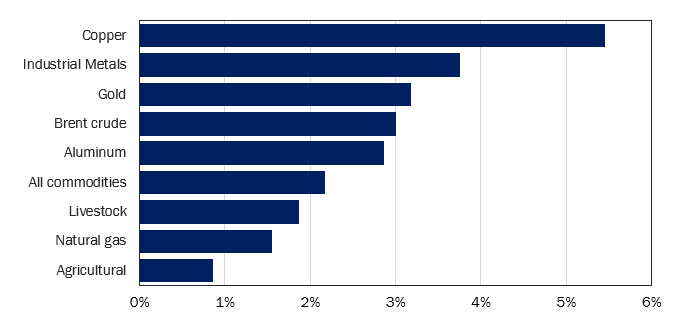
(Source: Goldman Sachs Global Investment Research, as of Feb. 29, 2024.)
Economic Calendar
Key Economic Releases and Events for the United States – 2024 Q3
FOMC Rate Decision: 31st Jul., 18th Sep.
GDP Figures: 25th Jul., 29th Aug., 26th Sep.
PMI Figures: 5th Aug., 5th Sep.
CPI Figures: 14th Aug., 11th Sep.