
All eyes were on the Fed entering the third quarter and—despite a wild ride for those playing ‘How many cuts will 2024 bring?’—September’s FOMC didn’t disappoint, with the US central bank’s opening salvo delivering a half-point reduction in rates and confidently tipping a soft landing as the most likely result of this policy cycle. Below, we offer a closer look at the data underlying the Fed’s decision, its impact on everything from stocks and bonds to real estate and commodities, as well as our outlook on what geopolitics, China stimulus, and a contentious US election could bring in Q4 and beyond.

Rayliant Global Advisors is a global investment manager with offices in Los Angeles, London, Hong Kong, Hangzhou and Taipei. With over US$15-billion in assets linked to Rayliant's strategies, its clients include some of the world's largest sovereign wealth funds, pension plans, and other institutional investors. Rayliant's award-winning team is an independent advisor to East West Bank regarding global economies and markets. East West Bancorp, Inc. (the parent company of East West Bank) holds a 49.9% stake in Rayliant Global Advisors.
Quarterly Commentary: Asset Classes
Equities
Having tried—and mostly failed—to handicap the Fed’s monetary endgame over much of the last year, pundits entered the final month of Q3 debating the magnitude of a clearly messaged pivot by the US central bank at its September FOMC meeting. Despite 105 of 114 economists polled by Bloomberg ahead of the decision expecting a 25-bps move, policymakers at the Fed elected to go big, initiating the easing cycle with a half-point cut. Between this long-awaited reduction in rates, generally favorable macro data pointing to a likely US soft landing, as well as solid corporate earnings, stocks around the world rallied higher in Q3, with the MSCI All Country World Index up 6.7% for the quarter, putting global equities’ gains for the year at over 19% (see Figure 1). Returns were especially strong for Emerging Markets (EM), whose gains outpaced those of their Developed Markets (DM) counterparts, driven by Chinese stocks’ late-September surge, up 17.9% for the quarter, on coordinated monetary and fiscal policy announcements just before China’s seven-day Golden Week holiday.
Figure 1: Equity Market Performance (Returns as of 30 September 2024)
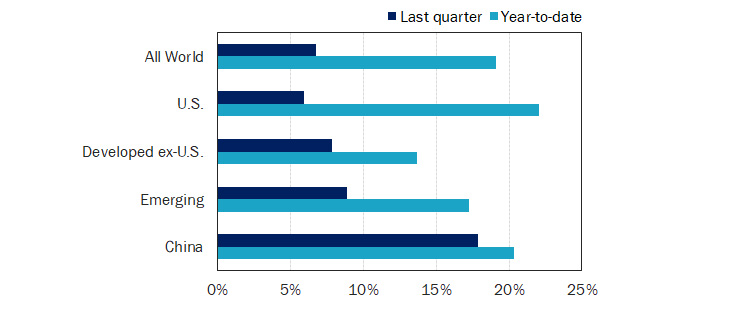
(Source: MSCI ACWI, S&P 500, MSCI World ex-USA, MSCI Emerging Markets, and CSI 300, all expressed in USD, except CSI 300 in CNY, via Bloomberg.)
While we suspect China’s stimulus push was timed to trigger maximum ‘FOMO’ going into an extended market holiday—thus delivering a bigger positive shock to onshore sentiment—we imagine the People’s Bank of China was also happy to announce rate cuts after the Fed had already eased by 50 bps. That wasn’t a foregone conclusion, as anyone knows who followed futures bets on the Fed’s pivot as the consensus for 2024 cuts slipped from up to seven quarter-point reductions near the start of this year, to just a single cut as of mid-April, finally narrowing to a range of 75 to 100 bps of easing by the end of the quarter (see Figure 2).
Figure 2: The Fed Takes Investors on an Emotional Rollercoaster in 2024
Looking back on the nine months prior to the Fed's September pivot on interest rates, it's remarkable to us how much volatility the year has witnessed in investors' expectations around US central bank policy. The year started with markets baking in up to seven cuts for 2024, hit a patch through the second quarter in which robust macro data gave the Fed reason to 'wait and see', and then switched gears again at the beginning of Q3, as soft jobs data stoked fears of a Fed falling fast behind the curve and at risk of overshooting. By late-October, traders saw two more cuts at the FOMC's final pair of meetings in November and December as nearly a foregone conclusion, though there was major debate as to whether rates would enjoy another 'jumbo' cut by year-end.
Market-implied probability of rate cuts in 2024, Jan. 2024 – Oct. 2024
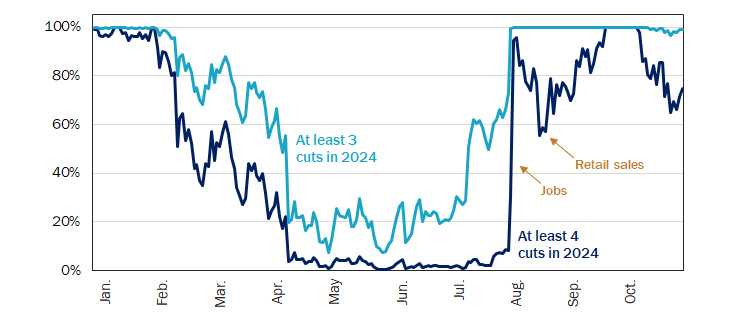
(Source: Rayliant Research, as of Oct. 25, 2024.)
That policy uncertainty was the upshot of sticky inflation in Q1, along with ample evidence past hikes weren’t hitting growth too hard. Though a grim nonfarm payroll report just after the July FOMC rekindled fears of a downturn, macro data through the end of the quarter painted a more favorable picture, increasing investors’ confidence that a soft landing might be in store for the first time since Alan Greenspan’s Fed brought rates down gently way back in 1995 (see Figure 3).
Figure 3: Over the Last Five Decades, Soft Landings Exceedingly Rate
Investors will probably be hard-pressed to find commentary on Q3 that doesn't drop the phrase "soft landing" in explaining why risk assets have done so well over the last few months. That particularly sweet scenario turns out to be an extremely unlikely one, judging by the last fifty years of data, in which time there has been a clear case of the Fed cutting rates without an attendant recession exactly once: back in 1995, when Alan Greenspan chaired the Fed, and the central bank only put in three rate cuts over a period of six months, cooling inflation without triggering a downturn. Interestingly, that was also the last time Treasury yields rose as much as they have this cycle after a Fed pivot, reflecting investors' caution that this round of easing might be likewise short-lived.
Fed Funds rate upper bound, plotted with hard and soft landings, Jan. 1980 – Sep. 2024
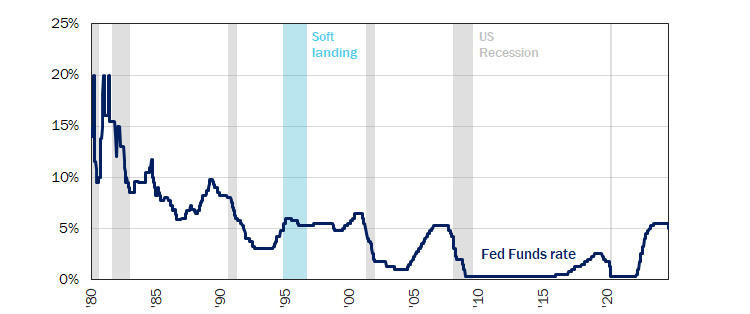
(Source: Rayliant Research, US Federal Reserve, NBER, as of Sep. 30, 2024.)
As we mentioned above, it’s that positive sentiment toward a soft-landing scenario which helped drive shares in the US and other Developed Markets to new all-time highs by the end of September. For S&P 500 stocks, gains came amidst an especially tumultuous US presidential election cycle, with the index ultimately posting its best performance in the first nine months of an election year since at least the early 1950s (see Figure 4).
Figure 4: S&P 500 Has Best Year-to-Date Run in an Election Year In 70+ Years
Although Fed policy was most in focus, the third quarter featured major drama in politics, as well, with President Joe Biden's disastrous performance at a June debate leading him to drop out in favor of Kamala Harris, who took over the Democratic ticket in late July. Earlier that month, a would-be assassin's bullet nearly killed the Republican candidate, former President Donald Trump, at a rally in the battleground state of Pennsylvania. And yet, despite this heightened uncertainty in domestic politics, US stocks managed to put in their best first three quarters in an election year since at least the early 1950s, with a return of nearly 21%. Along those lines, it's worth noting that three high-profile incumbent party losses—including 2000 and 2008—came when stocks were going the other way.
S&P 500 Index total return through 9/30 in US presidential election years, 1952 – 2024
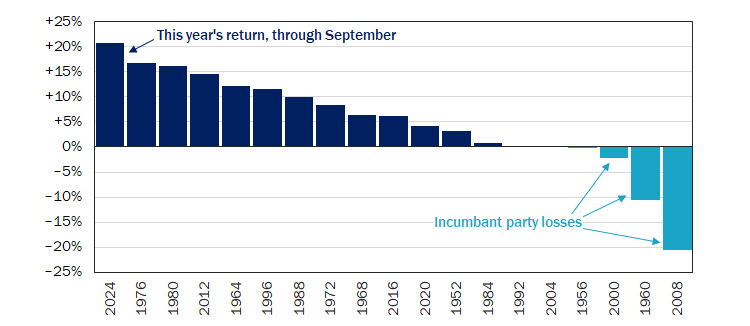
(Source: Rayliant Research, as of Sep. 30, 2024.)
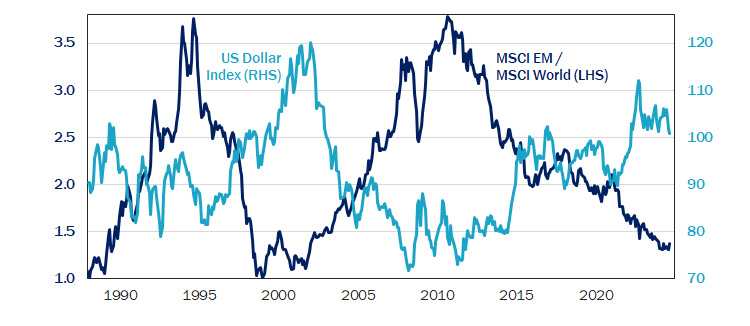
Of course, as equities have climbed, already lofty valuations have gone even higher, making a market like the US relatively pricey versus its own history—even after accounting for how strongly corporate earnings have grown. EM, on the other hand, hasn’t been this cheap relative to DM in over two decades, and we expect impending dollar weakening could help catalyze a reversal in EM stocks’ fortunes in the years ahead as the pendulum swings in the other direction (see Figure 5).
Figure 5: Dollar Weakening Has Historically Boosted Emerging Markets
Emerging Markets stocks have been nothing short of stellar through the first nine months of 2024. That said, their Developed Markets counterparts have done even better. That trend in relative performance has been at play for most of the last 15 years, leading many EM investors to wonder with 'diversification' by international investing really just works because EM shares return so much less than US stocks. On the other hand, looking back further, there have been some major cycles of EM outperformance, as well, and they've tended to occur when the dollar is weakening. To that end, the Fed's policy pivot should weaken the dollar and allow EM central banks to cut rates themselves, promoting growth—especially if Fed easing doesn't come with an export-sapping recession in tow.
Emerging vs. Developed Markets stocks and US dollar strength, Jan. 1988 – Sep. 2024
(Source: Rayliant Research, MSCI, as of Sep. 30, 2024.)
Fixed Income
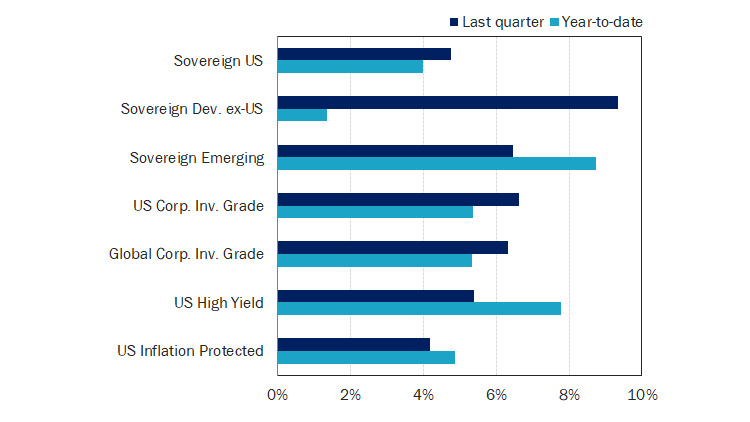
Just as with equities, much of the action in the fixed income space during Q3 hinged on expectations for the pace of easing by central banks around the world. With expectations building throughout the third quarter that the Fed was on the verge of unwinding high rates, and recognizing the inverse relationship between yields and prices, it’s no wonder bonds ended strongly in the black pretty much across the board over the last three months (see Figure 6).
Figure 6: Fixed Income Market Performance
Returns as of 30 September 2024
(Source: ICE US Treasuries Core, S&P Int. Sov. ex-US, JPMorgan EMBI Global Core, iBoxx USD Liquid Inv. Grade, Bloomberg Global Agg. Corp., iBoxx USD Liquid High Yield, Bloomberg US Gov. Inflation-Linked All Mat., all expressed in USD, via Bloomberg.)
That effect was especially pronounced, for example, in the rates-sensitive 2-year US Treasury Note, whose yield slipped over 111 bps during the quarter. That contributed to the yield curve steepening, as lower rates in the near-term reflect a comfortably cooling US economy, while long-term rates remain high, underpinned by expectations for continued economic growth—but also anxiety over the US fiscal deficit and ample supply of US Treasuries that markets will need to absorb.
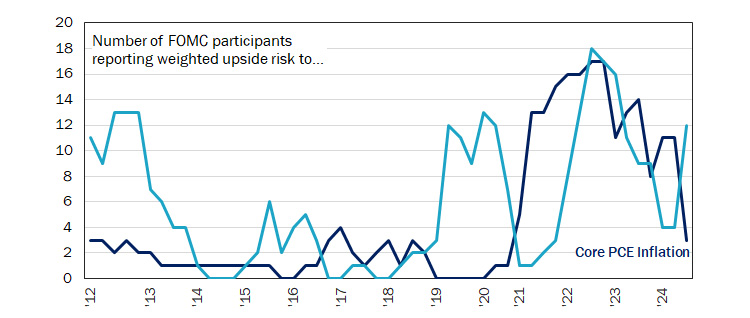
Investors trying to project just how far rates might fall and what impact that might have on bond returns over coming quarters will no doubt be poring over the Fed’s latest quarterly Summary of Economic Projections, which thankfully accompanied that jumbo rate cut in September. In trying to understand the Fed’s motivation, we found a tabulation of FOMC members’ risk perceptions to be most revealing (see Figure 7), with a fairly bumpy but definitively downward trend in worries over unhappy inflationary surprises, but even more importantly, a sudden spike in fears around unemployment at the September meeting, which underscores the Fed’s clear shift from inflation anxiety to fears the labor market could slow too abruptly and jeopardize a soft landing.
Figure 7: Fed Pivot on Rates Signals Shift of Worries from Inflation to Jobs
Those aware of the Fed's history will know it's fairly unusual to see a supersized rate cut to begin an easing cycle, outside of some major shock to the economy. To understand the state of mind in which US central bankers made such a move, it's helpful to look at FOMC members' self-reporting of risk perceptions as of their last meeting, data one finds in September's quarterly Summary of Economic Projections. Anxieties over unemployment and inflation were both gradually receding after the Fed sprang into action in 2022—at least until September, when a sudden flop-flop at the FOMC showed the balance of the Fed's fears dramatically shifting from rising prices to a softening labor market, framing that meeting's half-point cut as a strong reprioritization of the Fed's dual mandates.
Risks expressed in FOMC Summary of Economic Projections, Jan. 2012 – Sep. 2024
(Source: Rayliant Research, US Federal Reserve, as of Sep. 20, 2024.)
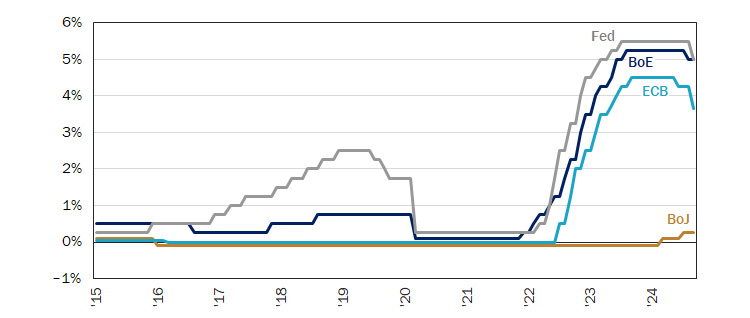
Monetary easing extended well beyond the US in Q3, with two of the Fed’s largest counterparts, the Bank of England (BoE) and the European Central Bank (ECB), also on a dovish trend at quarter-end (see Figure 8). Indeed, the BoE beat the Fed to its first cut by just about a month, beginning its easing in August—that was actually deemed to be enough for now, with the BoE choosing to take a breather in September—while the ECB, having already made its pivot back in June, followed up with a second consecutive cut at its own September policy meeting. All of that accommodation was music to the ears of EM central banks, many of whom had themselves already started easing in anticipation of cuts in the US and other major economies, and will be eager to continue easing after being forced to tighten when the US began hiking over two years ago.
Figure 8: As BoJ Contemplates Next Hike, BoE Holds, Fed and ECB Cutting
We often spend a seemingly inordinate amount of time talking about the Fed—but that's just because as goes the US, so go economies and markets around the world. Of course, it doesn't mean there wasn't plenty happening in central banking land at the end of Q3. While the Bank of England (BoE) elected to pause after its first cut of the cycle in August, the European Central Bank (ECB) faced a more daunting growth outlook and inflation softening at a comfortable clip, leading to a second consecutive quarter-point cut at its mid-September meeting. Meanwhile, the Bank of Japan (BoJ) sought to calm investors' nerves by pausing hikes, with policy already tighter than at any point since 2008, a fragile recovery in growth, and September yen strengthening taking some pressure off prices.
Various central bank policy rates, Jan. 2015 – Sep. 2024
(Source: Rayliant Research, US Fed, Bank of England, Bank of Japan, as of Sep. 30, 2024.)
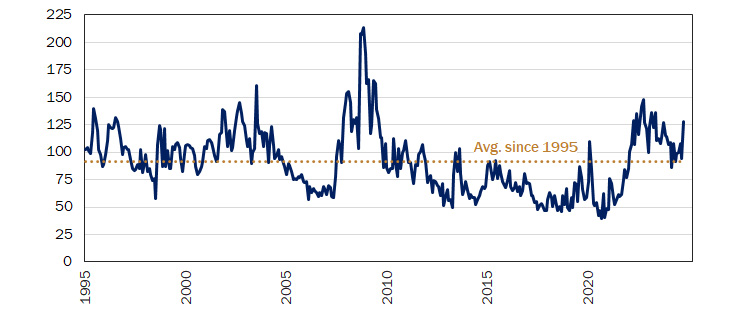
While all of this might sound like good news, there are a number of factors threatening to rain on bond investors’ parade as we enter the fourth quarter. Chief among those, in our mind, is a scenario in which inflation gets sticky again and puts central banks like the Fed in a difficult position, caught between the mounting risks to growth on the one hand—obvious in that chart of FOMC members’ economic projections—and rising prices that would seem to call for a much slower reduction in policy rates, on the other. It’s a situation which seems that much more precarious when one considers how little fiscal discipline governments have shown amidst a period of robust growth, leading long-term bond investors to reasonably worry whether yields are high enough to justify soaking up the aforementioned robust issuance most expect. Such concerns have helped in October to undo a good chunk of the third quarter’s retreat in Treasury yields, and they are quite apparent in a surging Move Index (see Figure 9), which could give us much more to talk about in next quarter’s fixed income commentary.
Figure 9: Fixed Income Volatility Spikes on Fed Policy, US Election Risks
Sharp changes in Treasury yields since the Fed's first move underscore just how much uncertainty there is as to the Fed's policy path going forward, and that's showing up as a big spike in the Move Index: similar to equities' VIX Index, but built to gauge stress in the bond market. That barometer, which averaged a reading of around 92 since 1995, has climbed from around 90 near the end of September to over 128 by late-October. It's not just the Fed's equivocating over the pace of cuts driving volatility. Many analysts have pointed to the US presidential election as another major source of uncertainty, with the former president's strong move in late polls stoking fears a second Trump term could bring bigger deficits, greater inflation, and higher terminal interest rates than a Harris win.
Monthly observations of the ICE BofA MOVE Index, Jan. 1995 – Oct. 2024
(Source: Rayliant Research, ICE BofA, as of Oct. 25, 2024.)
Alternatives
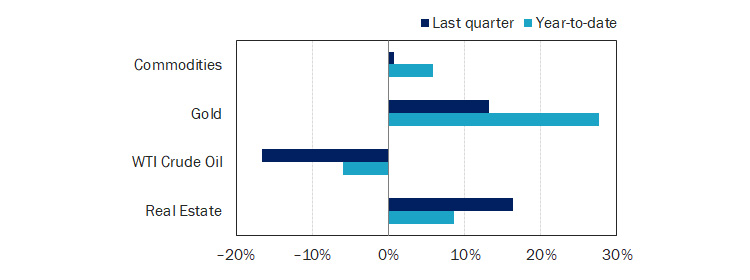
Though equities and fixed income markets moved during the third quarter to more firmly price in a US soft landing, the fortunes of commodities were mixed (see Figure 10). Precious metals put in another great quarter and represent the single best segment of the Bloomberg Commodity Index, year-to-date: no doubt a product of Fed rate cuts—which make it less expensive to carry the non-yielding asset—as well as heightened geopolitical tensions, sending Q3 world gold demand over $100 billion for the first time ever, according to the World Gold Council. Energy was, by contrast, the worst performing subindex over the last three months, with concerns that global growth could soften dominating potential supply-side risks, leading oil prices to slump by more than 16% for the quarter. We see energy, in particular, as an area where consensus bearishness exposes prices to potential upside shocks (see Figure 11).
Figure 10: Alternatives Performance
Returns as of 30 September 2024
(Source:Bloomberg Commodity Index, Gold Spot, WTI Crude, iShares International Developed Real Estate ETF, all expressed in USD, via Bloomberg.)
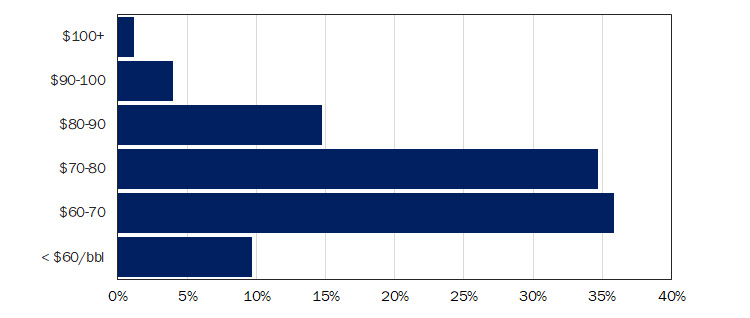
Figure 11: Economists Didn't See a Looming Rally in Oil—But China Could Change That
We've been bullish on energy for some time, noting what we've seen as increasing likelihood of a soft landing, the possibility of an economic recovery in China—something it's safe to say markets had not been pricing—along with concerns over tight supply in the face of OPEC+ production cuts and big geopolitical risks. This turns out to have been a contrarian view, as illustrated by a Bloomberg Intelligence survey near the end of Q3, showing most experts expect prices to end 2025 in the range of $60-80/barrel. Those polled on September 24th couldn't have known China would soon announce hefty stimulus, though they did rank "China demand story" a close second to "OPEC+ policy" in importance for oil prices over the next year: perhaps a positive sign if Beijing follows through.
Response % to survey question: Where will Brent crude close in 2025?
(Source: Bloomberg Intelligence Survey, as of Sep. 24, 2024.)
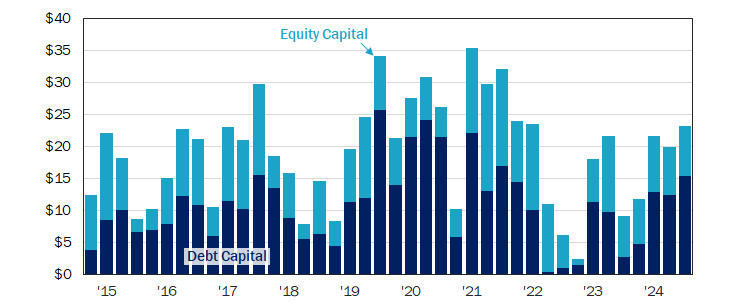
Last quarter, we commented on the potential for Fed cuts to quickly reverse negative sentiment which prevailed in the real estate sector over the first half of 2024, and REIT performance in Q3 proved that view out, with public real estate investments up 16.3% in the third quarter, flipping REITs to solid year-to-date gains. Part of our thesis on REITs has been that in such a challenging rates environment, many funds took an opportunity to shore up fundamentals; now, as the Fed begins to unwind its previously restrictive policy, those REITs are in a great position to take advantage of the changing tide. That fact has been borne out by a wave of capital raises at US REITs in Q3, pushing year-to-date equity and debt issuance to almost $65 billion (see Figure 12).
Figure 12: REITs Ramping Up Capital Raising in Year of Fed Pivot to Easing
After a weak first half of the year, REITs posted strong performance in Q3, given the Fed's pivot to easing, which may be unsurprising, given how hard the rate-sensitive stocks were hit by monetary tightening starting in 2022. Now, with the prospect of more rate cuts on the way, not only is sentiment among REIT investors improving, the funds themselves are seeing greater opportunities—as well as a better environment in which to secure funding for their investments. Balance sheet discipline amidst challenging conditions has also put REITs in a strong financial position. The combined effect has been a surge in fundraising through the first nine months of the year, adding up to nearly $65 billion, more than was raised in each of the last two full years, the majority by way of debt sales.
Quarterly total capital raised by US REITs, expressed in $ billions, Q4 2014 – Q3 2024
(Source: Rayliant Research, NAREIT, as of Sep. 30, 2024.)
Economic Calendar
Key Economic Releases and Events for the United States – 2024 Q4
FOMC Rate Decision: 7th Nov., 18th Dec.
GDP Figures: 30th Oct., 27th Nov., 19th Dec.
PMI Figures: 5th Nov., 4th Dec.
CPI Figures: 13th Nov., 11th Dec.

